


I have been tabulating and analysing Covid19 data on a daily basis for the past six weeks. While I spend a good deal of time in collating the same, it is startling when occasionally my figures differ with other reports. Disease statistics can be quite confusing at times. We see multiple versions of the same parameters reported by different people, despite the source data being identical.
The varying figures leave the readers of such reports in a dilemma as to the authenticity of the data, or analysis thereof. A glaring example is the growth rate of Covid. Multiple sources could quote varying figures of growth rate at the same time. Incidentally, all of them may be reporting correctly as per their norms.
The difference in the metrics crops up due to basic definition of a parameter, modalities of calculation and interpretation of the same.
Being neither an epidemiologist, nor a statistician, I have tried to explore the reasons for such differences, in pursuance to a logical explanation within common parlance. Let us start with Growth Rate. Growth Rate can be defined in multiple ways. It could be :
Daily increment over the previous day’s cumulative numberof cases, termed aptly as ‘Daily Growth Rate’.
Increment over a period of time (say 3 or 7 days) expressedas a percentage of base cumulative number, normalised to per unit time.
Moving Average of daily growth rate over a period of time(generally 3 days or 7 days).
Logarithmic Growth – Difference in logarithm value of casesover a period of time (say 1, 3 or 7 days), denoted as per unit time.
The logarithmic growth can be calculated both on base 10 ornatural logarithms.
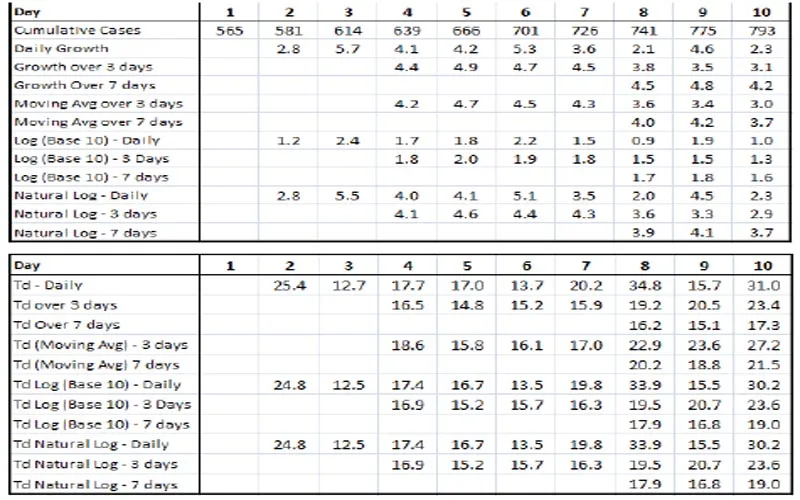
Thus, we see that for the same source data, we can have 11 growth rates. Eleven different figures, and all correct.
‘Time to Double’ is closely related to Growth Rate. It is defined as the time period (usually in days) over which the cases will double in number. One can compute Time to double as per the rule of 72 (adopted from Financial terminology), wherein the product of Growth rate and Doubling time is 72. For disease prediction in a logarithmic spread, Doubling time is calculated from the fact that the product of Growth rate and Doubling Time is logarithm value of 2. Again, this log could be to the base of 10 or natural logarithm. Thus, the 11 growth rates would lead to 11 Doubling rates, again all of them correct.
An indicative table (depicting the eleven growth rates in terms of percentage and doubling time in days) is shown here :
Similar is the plight of Recovery Rate and Fatality Rate. Recovery rate is the number of recovered cases as a proportion of total reported cases, whereas Fatality Rate is the number of deaths in proportion to total cases. Both these parameters can be calculated as :
Daily rate – Total cumulative recoveries/ deaths on asingle day proportionate to the cumulative cases on that day.
Moving Average of the above daily rates over a period oftime (generally 3 or 7 days).
Even this gives us 3 values each for Recovery and Fatality rate on a particular day. I have purposefully listed only the basic algorithms here, though there are many more in practice.
Another conspicuous difference occurs in the Testing Rate. Testing Rate being the number of tests conducted per Million population, deviations in this parameter could be attributed to diverse sources of population data. A lot of Data Analysts use the National Census Data, which incidentally was published last in 2011. This leads to biased figures as a consequence of using a decade old data. Many analysts employ more recently published population numbers, or the ones projected for current time span, to arrive at realistic results.
Well, there is no doubt that folks analysing this data are doing it on the basis of certain defined methodology or algorithms. So, when we are looking at these metrics, we need to understand the definition or method of calculation that it represents. These modalities have a pronounced impact on the inference to be drawn from such data and the related analysis.
The author has three decades of industry experience in global delivery management. His expertise lies in Entrepreneurial strategy, mentoring, and career counseling. He is currently acting as consulting advisor and mentor to several startups.